Contraindicated Drug Detection for Dravet Syndrome Using iPSC-Derived Brain Organoids
# iPSC Brain Organoids: Advancing Precision Drug Safety for Dravet Syndrome
Using iPSC-derived brain organoids, this assay reveals the risks of Carbamazepine (CBZ) in Dravet syndrome patients. In vitro evaluation showed distinct oscillation and voltage response patterns, confirming CBZ’s contraindication for DS treatment.

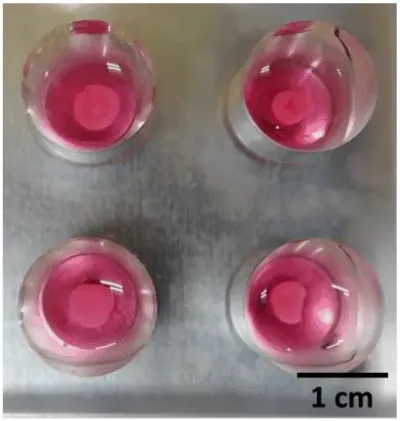
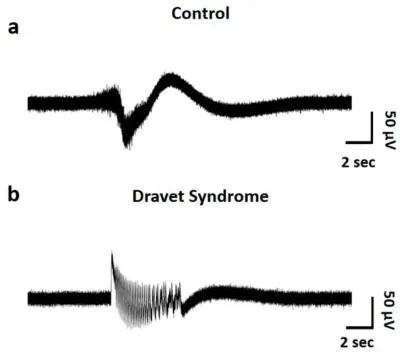
Dravet syndrome patient and healthy control iPSC lines were differentiated into cerebral organoids using the STEMCELL Technologies differentiation kit and plated on an MEA plate with highly sensitive electrodes for brainwave analysis. After 5–6 months of culture, distinct brainwave abnormalities were observed in Dravet syndrome patient-derived organoids.

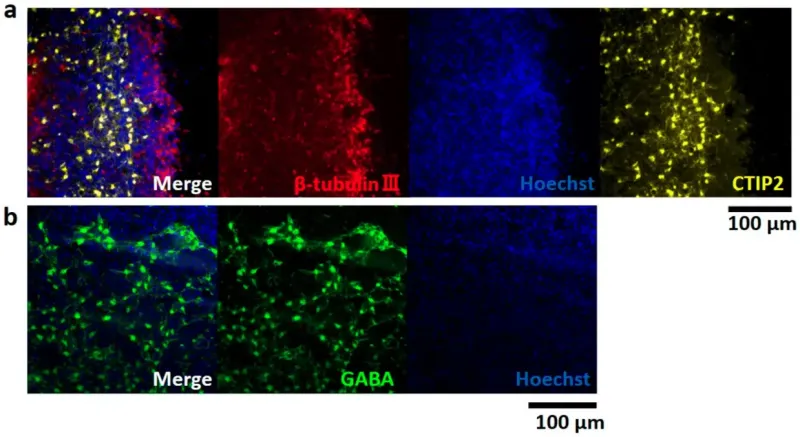
Image of immunofluorescence staining depicting an 8-month-old brain organoid. (a) β-tubulin III (red), CTIP2 (yellow), hoechst 33258 (blue). (b) GABA (green), hoechst 33258 (blue).

Representative raw waveforms of an oscillation in control (a) and DS brain organoids (b).

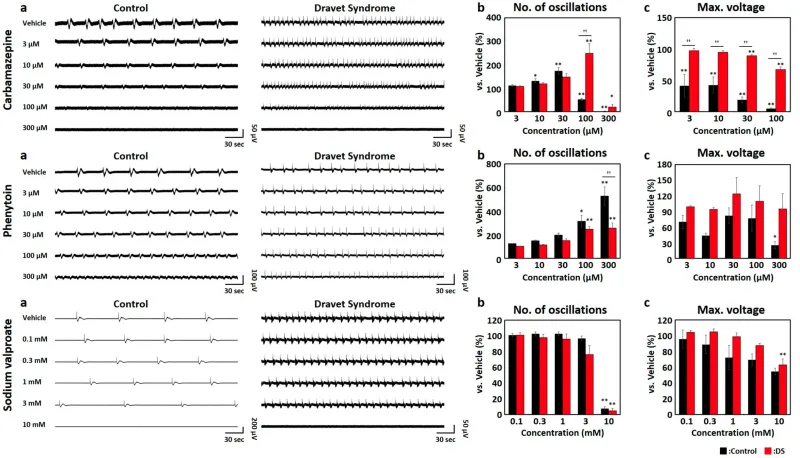
Alterations in (a) raw waveforms of spontaneous activities, (b) number of oscillations, and (c) maximum voltage (Max. voltage) in antiepileptic drug (AED) administration. Oscillation was identified in activity 30 min after AED administration, and changes in no. of oscillations and Max. voltage were assessed. Each analysis parameter was calculated and normalized with the vehicle data of each well as 100%. Each analytical parameter was evaluated using one-way ANOVA followed by the Holm–Bonferroni method (* p < 0.05, ** p < 0.01 vs. Vehicle, †† p < 0.01). Control (black). DS (red). From top to bottom, Carbamazepine (CBZ), Phenytoin (PHT), Sodium valproate (VPA)
Contraindicated Drug Responses in DS Brain Organoids
To assess the response of DS brain organoids to contraindicated drugs, specifically CBZ and PHT, as well as the therapeutic VPA, we conducted dosing experiments. The analysis involved assessing the number of oscillations and the maximum voltage (Max. voltage) during oscillatory periods for each compound. Since the electrical signals recorded through MEA reflect the combined activities of multiple neurons, the Max. voltage acts as an indicator of the intensity of the oscillatory activity.
In the context of CBZ, a dose-dependent increase in the number of oscillations was observed in both the control and DS groups up to 30 μM. However, at 100 μM, a substantial reduction in frequency was evident in the control, reaching 51.2% ± 5.31% (p < 0.01, determined using the one-way ANOVA and Holm–Bonferroni methods). Conversely, in the DS samples, a significant elevation to 248 ± 41.2% (p < 0.01) was noted, highlighting a pronounced divergence in response between the control and DS groups. The Max. voltage demonstrated a notable decrease in the control samples, ranging from 3 μM to 41.1 ± 18.2% (p < 0.01). However, within the DS samples, the reduction was moderate, only reaching 67.1 ± 4.27% even at 100 μM. Notably, a significant discrepancy in Max. voltage between the control and DS groups was observed, starting at 3 μM (p < 0.01). In the context of DS, while the frequency increased, the oscillation amplitude was maintained.
Upon PHT administration, both the control and DS groups exhibited a dose-dependent escalation in the number of oscillations. Nonetheless, a notable discrepancy in response between the control and DS groups emerged at 300 μM [p < 0.01]. Notably, a significant reduction in Max. voltage was exclusively observed in the control samples at 300 μM [p < 0.05]. Analogous to CBZ administration, DS retained oscillation intensity, while frequency exhibited an increase.
For the therapeutic VPA, the number of oscillations significantly decreased at 10 mM in control samples to 7.64 ± 2.12% (p < 0.01) and in DS samples to 4.69 ± 3.31% (p < 0.01). Max. voltage decreased in a dose-dependent manner in both the control and DS samples. During VPA administration, there was no significant difference in response between the control and DS groups. However, DS brain organoids administered with the contraindicated drugs CBZ and PHT exhibited a response similar to other contraindicated drugs, with an increase in oscillation frequency while maintaining oscillation intensity.