Brain Wave Abnormalities in Dravet Syndrome Patient-Derived Organoids
# Highly Sensitive MEA Reveals Neural Oscillation Abnormalities in Dravet Syndrome Organoids
VitroVo’s advanced brainwave analysis models clinically reported disease phenotypes observed in EEG using in vitro organoid cultures on MEA

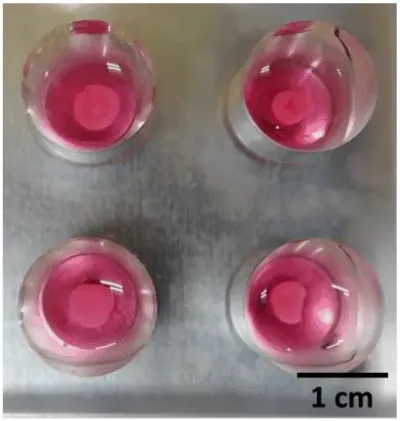
Dravet syndrome patient and healthy control iPSC lines were differentiated into cerebral organoids using the STEMCELL Technologies differentiation kit and plated on an MEA plate with highly sensitive electrodes for brainwave analysis. After 5–6 months of culture, distinct brainwave abnormalities were observed in Dravet syndrome patient-derived organoids.

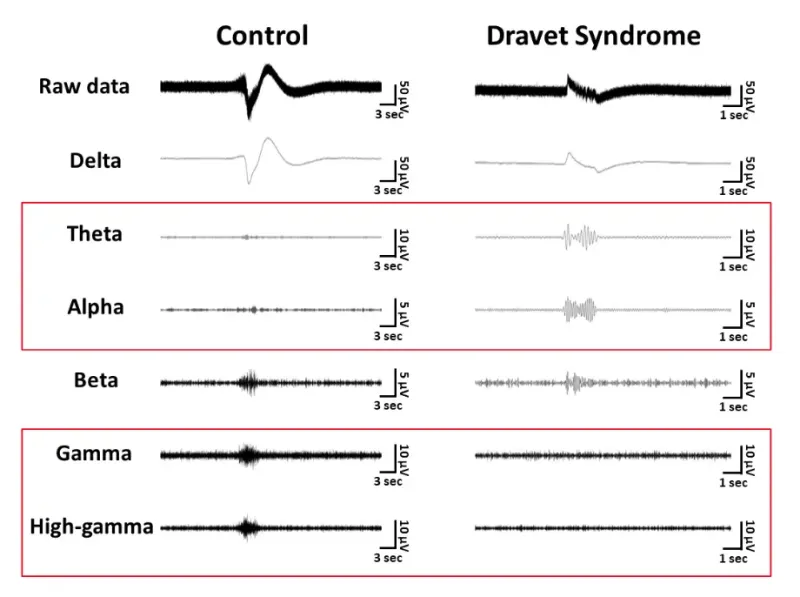
Spontaneous activity waveforms for each frequency band. From top: raw waveform, delta, theta, alpha, beta, gamma, high-gamma waveforms. Controls (left), DS (right).

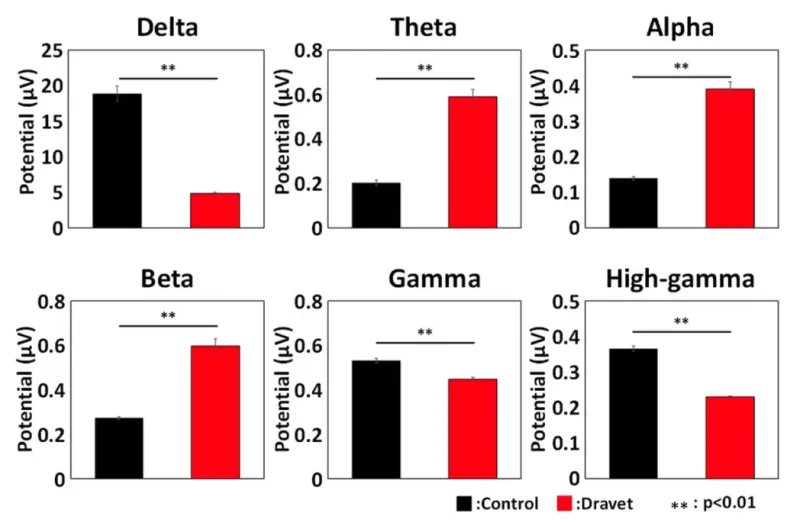
Potentials for each frequency band. Oscillation was detected from spontaneous activity recordings (n = 17) of controls and DS organoids cultured for 5–6 months, and potentials were calculated for each frequency band. Statistical analysis was performed using one-way ANOVA and the Holm–Bonferroni method for each frequency band’s potential in controls and DS organoids (** p < 0.01). Controls (black), DS (red).